
Most researchers running online insight communities are working without a benchmark. Not because they're not paying attention — but because publicly available data on what good actually looks like is genuinely hard to find. So 65% participation feels like a win, because no one has told them 74–90% is achievable.
We’re here to change that.
What follows are the community engagement benchmarks Recollective has tracked across hundreds of long- and short-term research communities: participation rates, retention, completion and activity cadence. Each metric comes with context for what it actually signals about insight quality — not just platform health.
If you run research communities, this is the data your stakeholders wish you had.
What Does Strong Insight Community Performance Actually Look Like?
The short answer: it depends on the type of community you're running. A two-week concept testing study operates completely differently than a twelve-month insight community, and holding them to the same benchmark sets the bar in the wrong place.
Here's how performance breaks down across community types — and where the industry typically lands by comparison.
The gaps matter more than the individual numbers. A community retaining 89% of members across a six-month engagement isn't just outperforming one at 65% — it's generating meaningfully different data. More consistent voices, deeper longitudinal context and fewer gaps in how insights develop over time.
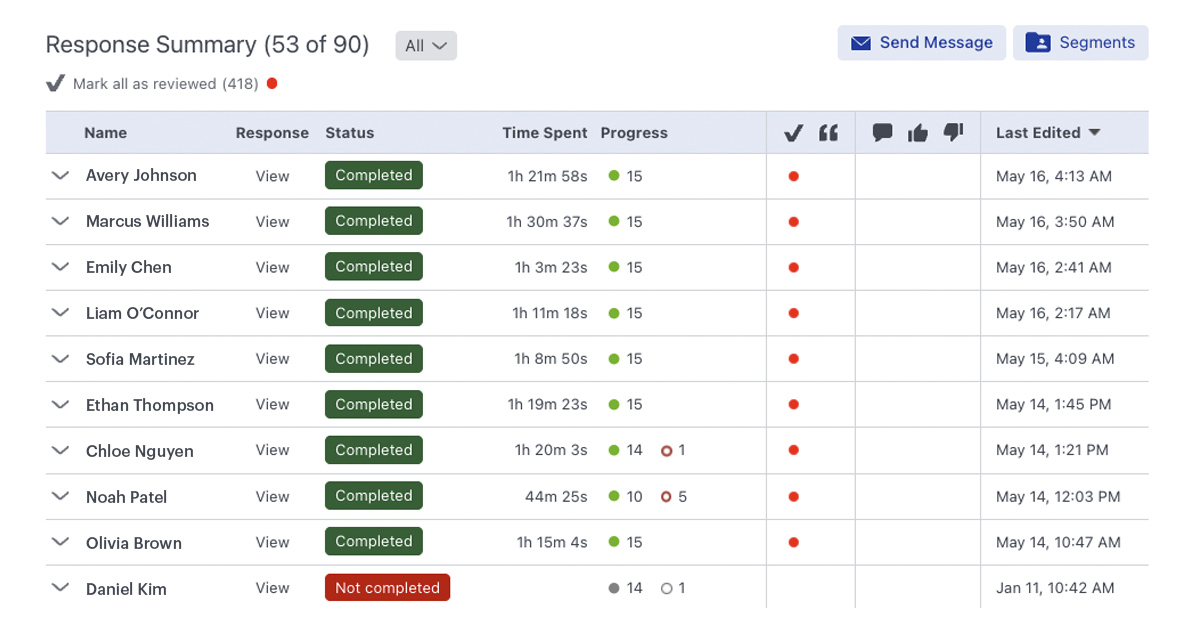
Participation Rate vs. Completion Rate: Why They're Not the Same Signal
Participation rate — the percentage of members who engage with activities in a given period — is the most visible metric in community reporting. It's also the easiest to inflate with low-effort tasks.
A 90% participation rate on a single-click poll tells you almost nothing about insight quality. A 90% completion rate on a structured discussion activity with open-ended prompts and follow-up probes tells you a great deal.
Completion rate is the sharper signal. It measures whether members are actually doing the work — finishing activities as designed, not just opening them. For short-term Recollective communities, completion rates run as high as 93%. For six-month communities, 78% is the benchmark. Industry averages sit between 65–80% regardless of duration, largely because activity design is often the differentiating variable.
If your participation rate is high and your completion rate is low, the data is telling you something specific: the activities are accessible enough to start and not compelling enough to finish.
How Long Should Community Members Stay Active?
Retention is where long-term community management either earns its keep or quietly erodes.
The industry norm for retention — the percentage of recruited members who remain active and engaged across the life of a project — sits between 60–80%. Recollective communities average 89% for long-term projects and over 96% for short-term ones. The difference isn't accidental. It comes from three places: the quality of initial recruitment (did you bring in members whose experience is genuinely relevant to the research questions?), the design of activities (is participation worth their time?), and communication cadence (do members feel like part of something meaningful, or like they're receiving periodic surveys from a stranger?).
Month three is the real test for long-term communities. The first month is easy — members are new, curious, recently opted in. By month three, the novelty has worn off. Retention at that point reflects whether the experience itself is holding people, not just their initial commitment.
If your numbers drop sharply between month one and month three, something in the experience is eroding commitment before the research has a chance to go deep.
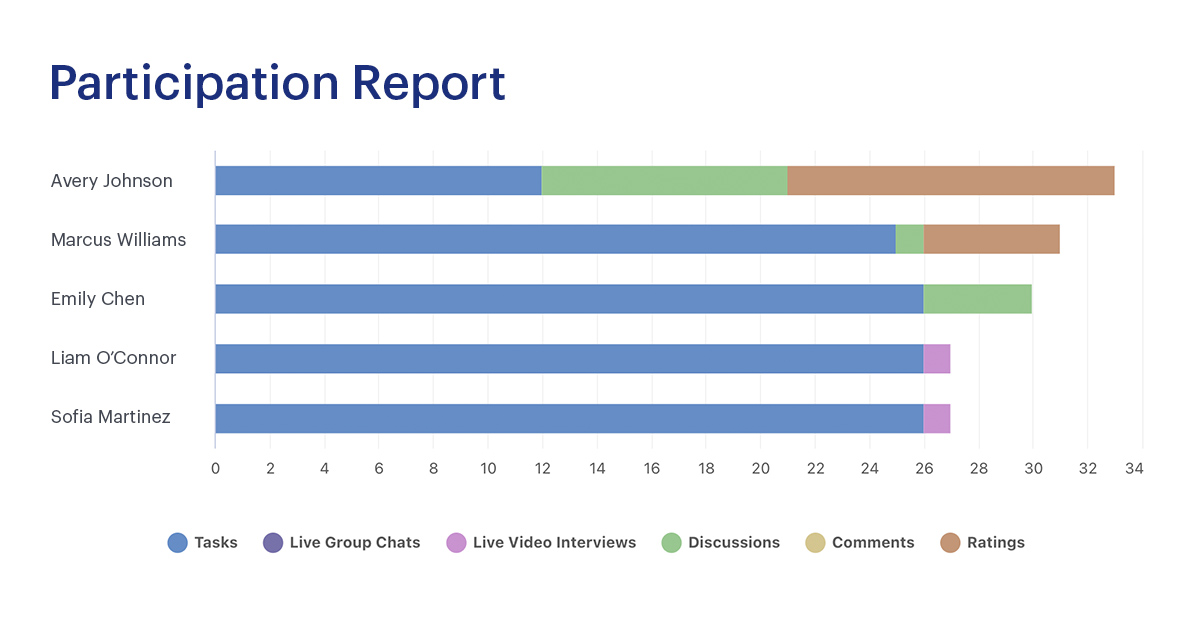
Activity Cadence: Why More Is Usually Less
One of the most consistent mistakes in long-term community management is treating activity frequency as a proxy for engagement quality. Push hard enough and members will respond — until they don't.
Research communities that run three or four activities per week in a six-month engagement almost always see burnout by the mid-point. Response quality drops before the volume does. Members start completing activities in less time, with less depth, in ways that are harder to detect in aggregate until the analysis stage.
The data supports a different cadence. Communities running one to two structured activities per week sustain stronger completion rates and meaningfully higher-quality responses than those that push heavy schedules early. The industry average of one to three activities per month often errs the other direction — too sparse for members to stay genuinely connected to the research.
Consistent without being relentless is the operating principle. Members need a reason to return each week, not a reason to withdraw.
The Case for Quarterly Refreshes (and Why Annual Isn't Enough)
Twelve-month insight communities face a specific challenge: even a highly retained member group starts to represent a narrowing slice of perspective over time. People who have been in a community for eight months have shared a lot of themselves. Their responses often become more considered, more shaped by the community's own norms. Without new voices, familiar patterns get reinforced and insights get predictable.
Annual member refreshes — the industry default — aren't enough to counteract this. A quarterly refresh of roughly 30 new members per 100 existing participants maintains diversity of perspective without disrupting the community's continuity or requiring full-cohort recruitment cycles. Recollective communities using this approach consistently generate stronger stakeholder perception of insight quality across the back half of long engagements, precisely because the research questions encounter genuinely fresh responses.

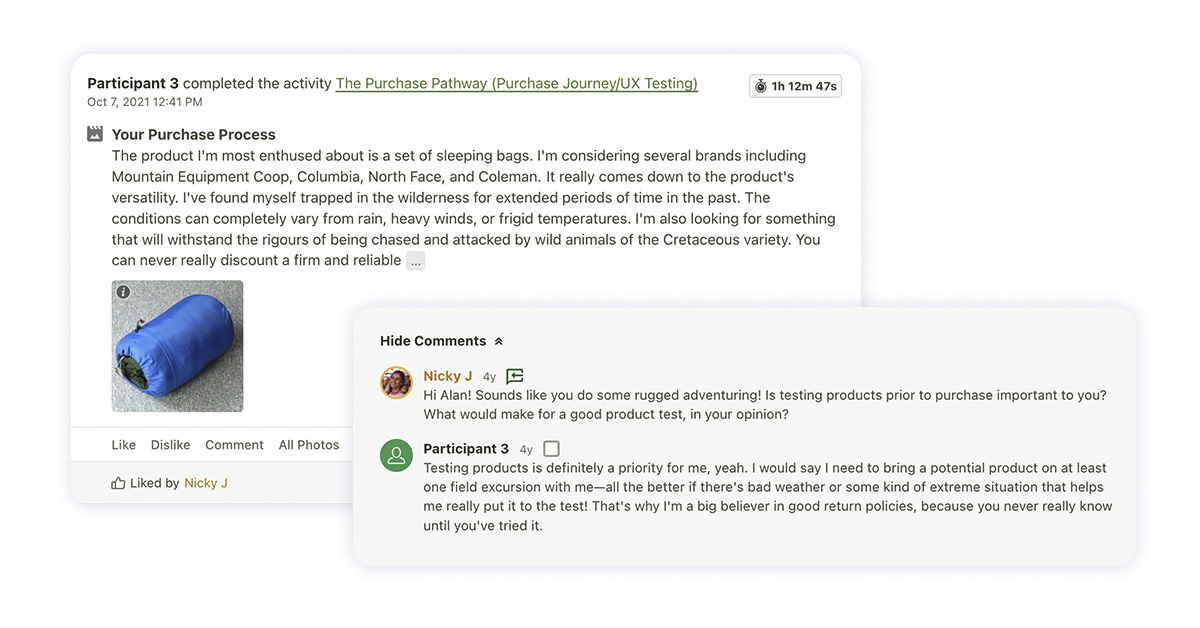
What the Numbers Can't Tell You
Metrics give you the signal. They don't give you the story.
The strongest communities in raw benchmark terms have also been the ones where the moderation team noticed something the numbers couldn't capture: a shift in tone across a discussion thread, a cluster of responses that contradicted the survey data, a participant who articulated something that changed the way the whole research team thought about the question.
That qualitative layer sits underneath every benchmark. It's the difference between members completing activities and members genuinely participating — and between a community that performs and one that produces insight that shapes actual decisions.
Horowitz Research built an insight community with Recollective to support a major publisher's rebrand for a digital-first audience. The community delivered strong retention and completion numbers throughout. But the real output was insight that directly shaped product development, marketing strategy and customer experience decisions over the life of the engagement. Stakeholders referenced it. Decisions changed because of it. That's the ROI the metrics were pointing toward — but couldn't, on their own, fully describe.
Four Questions to Benchmark Your Own Community
If you want to evaluate your current community honestly, start here:
A Starting Point, Not a Ceiling
The benchmarks in this piece aren't targets to hit — they're a starting point for understanding what strong performance looks like and where your communities might have room to go further.
If you're running an insight community and you're not sure how it compares, that's the first problem worth solving. The data to do that now exists.
Talk to the Recollective team about your research community needs.


.svg)