Qualitative Data Analysis Doesn't Have to Be a Black Box
There is a version of qualitative data analysis that most researchers have lived through at least once. You have hundreds of responses, dozens of transcripts, video clips and open-ended prompts. You read through them. You write notes. You read through them again. Eventually — somehow — an insight emerges, fully formed and you write the report.
This approach produces real findings. It has done so for decades and continues to. Where it creates difficulty is at scale — as sample sizes grow, the lack of structure makes findings harder to defend, harder to replicate and slower to produce.
Qualitative data analysis is not a mysterious process that happens after enough time with the data. It is a structured, repeatable set of moves — and researchers who approach it that way consistently produce faster, clearer and more defensible insights than those who don't.
Here is how it actually works.

What Makes Qualitative Analysis Different
Quantitative analysis answers "how many" and "how often." Qualitative analysis answers "why" and "what does it mean." The difference is not just in the data type — it is in what you do with it.
In quantitative work, the analysis is largely predetermined. The survey is designed, the statistical tests are chosen, the outputs follow from the inputs in a structured way. In qualitative work, the analysis is interpretive. You are not counting occurrences and reporting percentages. You are building an understanding of how people think, feel and make decisions — and that understanding has to be constructed from what participants said, not just tallied.
That interpretive dimension is also what makes qualitative analysis feel hard to pin down. But interpretation does not mean subjectivity without structure. The researchers who do this well follow a process. They make their reasoning visible. They can show you exactly how they got from the raw data to the insight on the page.
The Core Method: Thematic Analysis
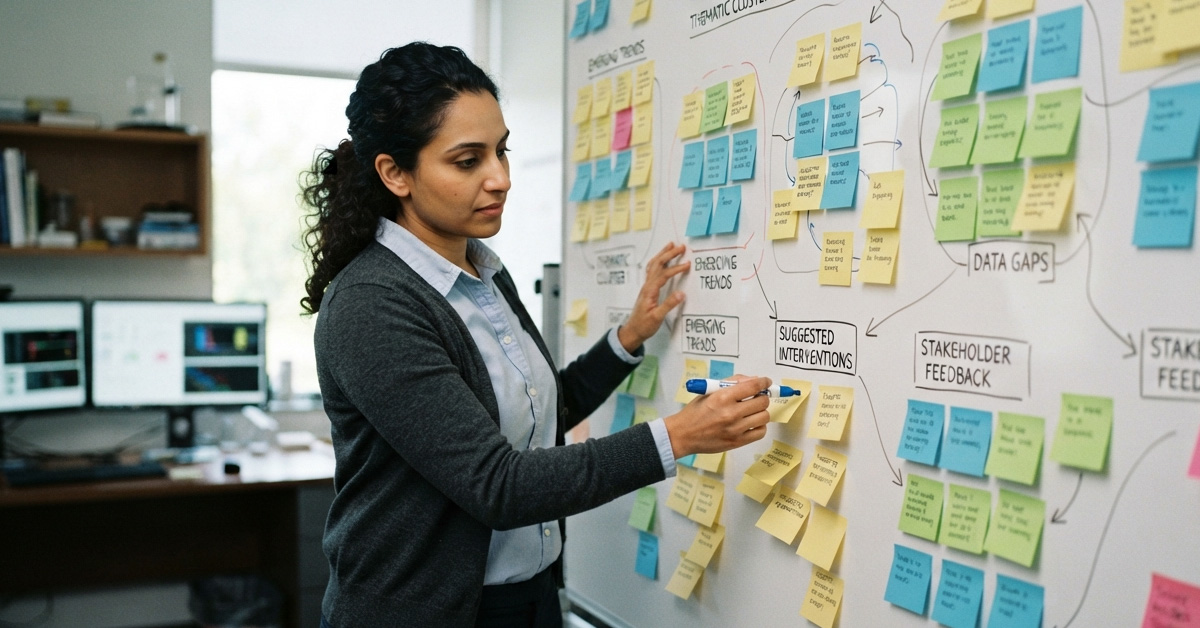
For most commercial qualitative research — online communities, bulletin boards, IDIs, focus groups, diary studies — thematic analysis is the workhorse method. It is flexible, transparent and appropriate whether you have twenty responses or two thousand.
Thematic analysis produces themes: patterns of meaning that appear consistently across your data and that relate to your research objective. A theme is not a topic ("participants discussed pricing"). It is a pattern of meaning ("price sensitivity is expressed through comparison behavior, not stated reluctance").
The distinction matters because topics describe what was talked about, while themes describe what the data is telling you.
Thematic analysis is not a purely post-fieldwork activity. In practice, ideas and candidate themes begin forming the moment fieldwork starts. The process below is where those early instincts get pressure-tested, refined and structured into defensible findings.
Where AI Fits Into This Process
AI has changed qualitative data analysis — genuinely and significantly — in ways that experienced researchers are still figuring out.
The areas where AI earns its place:
Transcription. Automatic transcript generation eliminates one of the most time-consuming tasks in qual analysis, and modern accuracy rates are high enough that light editing is all that is needed.
First-pass code suggestions. AI can scan a dataset and surface patterns in language that a human would eventually find but might take hours to identify manually. In practice, researchers actively using these tools don't see the output as the answer — they use it as a starting point, then apply their understanding of the project and the client to decide what's actually important. Treat AI-generated codes as hypotheses to test, not conclusions to adopt.
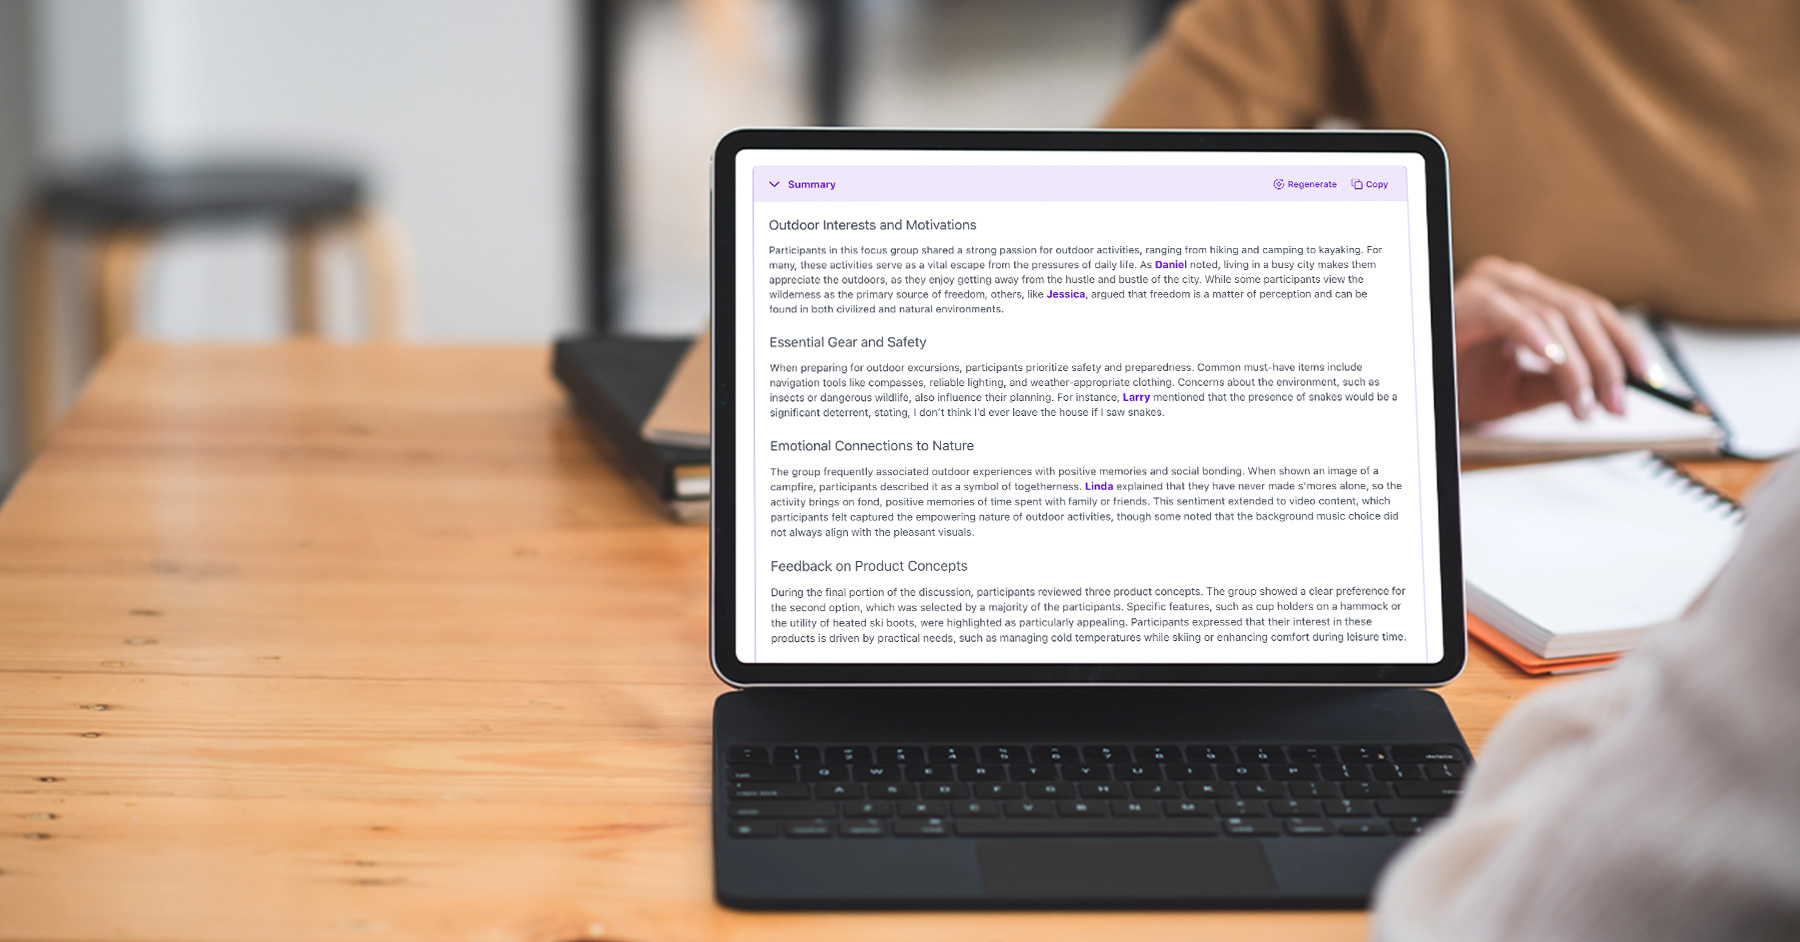
Summarization across participants. When you need to understand the range of responses to a specific question or activity across a large participant set, AI summarization produces a useful overview faster than manual review. Again, this is a starting point for your analysis, not a substitute for it.
Cross-study synthesis. Comparing themes across multiple studies or time periods — "how has sentiment toward X changed since last quarter?" — is where AI can do something a human analyst would find genuinely time-consuming.
The areas where AI does not replace human judgment:
The interpretive work — understanding what a theme means in the context of your client's business, identifying the tension in the data, recognizing that the outlier is more important than the majority response — requires a researcher. AI can accelerate the work of getting to the themes. It cannot do the work of understanding what the themes mean.
Use AI to clear the runway. Use your expertise to land the plane.

The Most Common Mistakes
Starting analysis only after all fieldwork is complete. The strongest qual analyses are iterative — findings from early sessions inform how later sessions are moderated. If you wait until all the data is in to begin analysis, you lose that feedback loop. Start coding after the first few sessions. The one caveat: early signals are directional, not conclusive. Starting analysis during fieldwork is not the same as closing it. The client who watches the first group of many and is ready to make decisions is a familiar hazard — the rest of the fieldwork often adds significant nuance, or contradicts the early read entirely. Analyse as you go. Hold conclusions until the full picture is in.
Reporting findings instead of insights. A finding is what participants said. An insight is what that means for the decision at hand. "Participants expressed strong preference for faster turnaround times" is a finding. "Speed is the primary trust signal in the agency-client relationship — not quality of output" is an insight. The second is what your stakeholders can act on.
Over-representing the most vocal participants. In any qualitative study, some participants produce more data than others. More data is not the same as more representative. Build your themes from the pattern across participants, not from the weight of any single voice.
Burying the unexpected finding. When something in the data contradicts the hypothesis, the instinct is to note it briefly and move on. This is exactly backwards. Unexpected findings are usually the most valuable thing in the dataset. Give them the space they deserve, even when that requires a difficult conversation with the stakeholder who came in with a strong prior belief.
Communicating Qualitative Findings
Analysis ends when the insight is ready to be communicated — which means it does not end when the themes are named. The translation from rich qualitative data to a stakeholder-ready report is its own skill.
A few things that consistently improve qualitative reporting:
Lead with the insight, not the methodology. Stakeholders want to know what the data means for their decision. The details of how you got there belong in an appendix.
Use participant language. Direct quotes — even a few words, not necessarily full sentences — make findings tangible in a way that paraphrasing does not. The participant's actual words carry weight that a researcher's summary of them cannot.
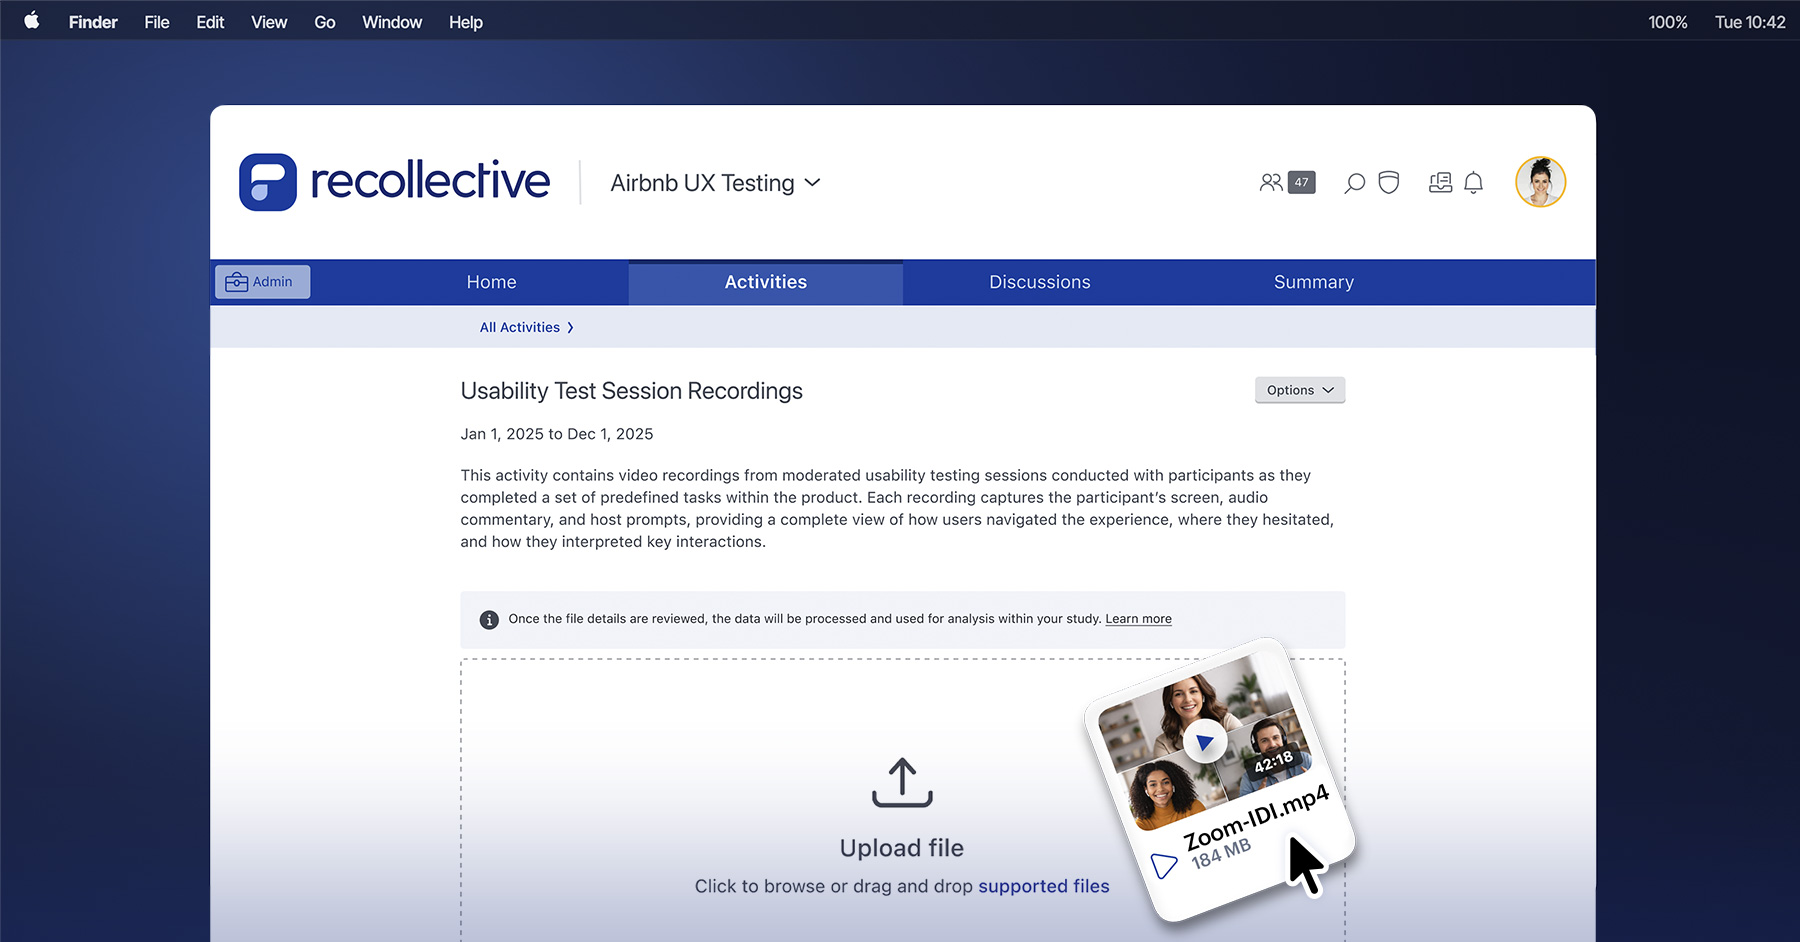
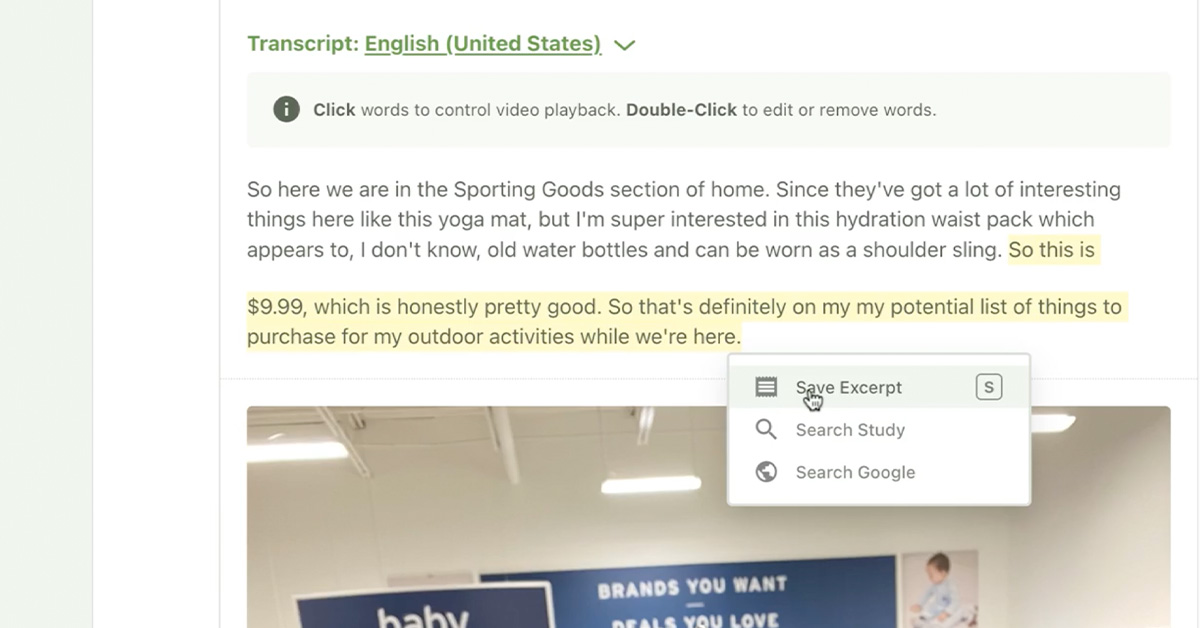
Video highlight reels, where available, change the room. Watching a participant explain their experience in their own voice is more persuasive than any slide. If your research includes video, build a short reel of the most compelling moments. It is the single most effective communication format for qualitative findings.

Analysis as a Competitive Advantage
The researchers who consistently produce the clearest, most actionable insights are not necessarily the ones who collected the best data. They are the ones who have made their analysis process rigorous enough to be efficient, transparent enough to be defensible and structured enough to be repeatable.
That is not a natural talent. It is a practice.